Estimated data from the World Bank’s overview (2025) were mainly used to determine the global population (see table below). These data were used to calculate the shares of the global population if no absolute or percentage data were available from the relevant source. If other sources were used, they are noted in the comments.
![[Translate to English:] Das Globale Dorf mit 100 Menschen](/fileadmin/files/_processed_/d/9/csm_2_004_Globale_Dorf_C_Bookwire_72dpi_d10a2f4bae.jpg)
Verlag Bertelsmann Stiftung
The Global Village of 100 People
Below you will find the sources, including notes, that were used to write the texts, design the graphics and compile the datasets for The Global Village of 100 People. The sources are grouped according to the 40 topics that appear in the book.
Content
1 Continents
Deutsche Stiftung Weltbevölkerung (DSW) (2022). DSW-Datenreport 2022. Soziale und demografische Daten weltweit. Hannover. Page 8 ff. https://www.dsw.org/wp-content/uploads/2023/11/DSW-Datenreport_2022_web.pdf. Accessed March 4, 2025.
The percentages of the world population (share of 100%) shown in the illustration were taken from the DSW report and the table on population by world region. A world population of 7,963 million people (as of mid-2022) was used to calculate percentages for Asia, Africa, Europe, Latin America/Caribbean, the United States and Canada, and Oceania based on figures for those regions in millions.
Deutsche Stiftung Weltbevölkerung (2025). Weltbevölkerung. https://www.dsw.org/weltbevoelkerung/. Accessed March 16, 2025.
2 Countries
Deutsche Stiftung Weltbevölkerung (DSW) (2022). DSW-Datenreport 2022. Soziale und demografische Daten weltweit. Hannover. Page 8 ff. https://www.dsw.org/wp-content/uploads/2023/11/DSW-Datenreport_2022_web.pdf. Accessed March 4, 2025.
The percentages of the world population (share of 100%) were taken from the DSW report and the table on population by world region or continent and by country. A world population of 9,752 million people (forecast for the year 2050) was used to calculate percentages for Asia, Africa, Europe, Latin America/Caribbean, North America and Oceania based on figures for those regions in millions. The population shares of Central America were allocated to North America. Finally, figures for the most populous countries for 2022 and 2050 were used to compare the distribution of populations and graphically illustrate possible future developments. Total world population figures of 9.75 billion people (forecast for 2050) and 7.96 billion people (as of mid-2022) were used based on the DSW report.
United Nations Department of Economic and Social Affairs, Sara Hertog, Patrick Gerland and John Wilmoth (2023). India Overtakes China as the World’s Most Populous Country. UN Department of Economic and Social Affairs (DESA) Policy Briefs. June 15, 2023. DOI: https://doi.org/10.18356/27081990-153. Accessed March 16, 2025.
3 Age
Deutsche Stiftung Weltbevölkerung (DSW) (2022). DSW-Datenreport 2022. Soziale und demografische Daten weltweit. Hannover. Page 3. https://www.dsw.org/wp-content/uploads/2023/11/DSW-Datenreport_2022_web.pdf. Accessed March 4, 2025.
DSW is an internationally active development organization. Its goals are to support the world’s largest generation of young people ever, to promote human rights and to contribute to sustainable population development. The figures from the DSW report were used to create the illustration in the book. The distribution of age groups (up to 14 years, 15–64 years, over 65 years) was taken from the illustration in the DSW report.
4 Native languages
and
5 World languages
CIA (2023). The World Fact Book. https://www.cia.gov/the-world-factbook/about/archives/2023/countries/world/. Accessed March 4, 2025.
The World Factbook published by the US Central Intelligence Agency (CIA) provides basic information on societies, economies, energy, geography, environment, communications, transportation, military, terrorism and transnational issues for 265 world regions. It brings together publicly available data for various categories, providing a multifaceted view of how the relevant topics interrelate. Information on the distribution of mother tongues and (learned) foreign languages was taken from the factbook to show the diversity of languages around the globe.
Zimmermann, Klaus (2016). „7. Missionarslinguistik in kolonialen Kontexten. Ein historischer Überblick“. Sprache und Kolonialismus: Eine interdisziplinäre Einführung zu Sprache und Kommunikation in kolonialen Kontexten. Thomas Stolz, Ingo H. Warnke and Daniel Schmidt-Brücken, eds. Berlin and Boston. Pages 169–192. https://doi.org/10.1515/9783110370904-008. Accessed March 16, 2025.
6 Religion
Pew Research Center (2022). Religious Composition by Country, 2010–2050. https://www.pewresearch.org/religion/feature/religious-composition-by-country-2010-2050/. Accessed March 4, 2025.
The Pew Research Center is part of the Pew Charitable Trust. The figures on population by country were taken from the center’s dataset. The Pew Research Center was selected because it provides comprehensive analyses of and forecasts for the main religious groups for several countries and world regions and for the entire world. To calculate the figures shown in the illustration, the projected population figures for the relevant countries were divided by the total world population and the percentages calculated for 2020 and 2050.
Forschungsgruppe Weltanschauungen in Deutschland (fowid) (2024). Religionszugehörigkeiten 2023. https://fowid.de/meldung/religionszugehoerigkeiten-2023. Accessed March 16, 2025.
The figures on religious affiliation in Germany were taken from the dataset assembled by the Forschungsgruppe Weltanschauungen in Deutschland (fowid) for the year 2022. An independent research institute located in Germany, fowid uses evidence-based methods to collect data at regular intervals on various aspects of the worldviews held by people in Germany.
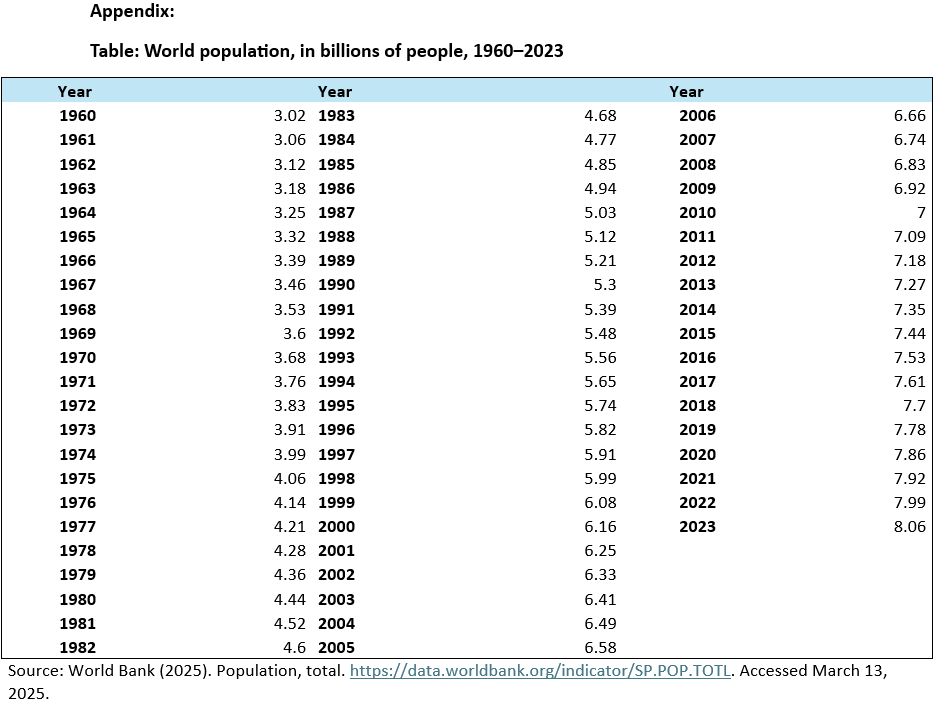
7 Place of residence
World Bank Group (2023). Urban Development. https://www.worldbank.org/en/topic/urbandevelopment/overview. Accessed March 4, 2025.
World Bank Group (2025). Urban population (% of total population). https://data.worldbank.org/indicator/SP.URB.TOTL.IN.ZS. Accessed March 4, 2025.
The World Bank Group is a multinational development bank active in many areas of economic development work. The two sources given for global urban population and its development were used because the report (first source) on current urban population also includes a forecast for 2050. The second source was used to determine estimated shares of the global urban population for past years (1960–2023).
8 Slums
United Nations (2023). The Sustainable Development Goals Report 2023: Special edition. Towards a Rescue Plan for People and Planet. New York. https://unstats.un.org/sdgs/report/2023/The-Sustainable-Development-Goals-Report-2023.pdf. Accessed March 4, 2025.
Fully subject to international law, the United Nations is one of the global community’s most important policy institutions. It regularly releases a report on its Sustainable Development Goals that examines current global developments and offers forecasts for a range of topics: poverty, urbanization, infrastructure and public services. The report thus provides a comprehensive dataset on slums and the risk of poverty among the world’s population – a crucial resource for this book, since one of its main aims is to illustrate how varied everyday life can be for different people. The UN report offers current data (2022–2023) on slum populations worldwide (in billions of people) and forecasts of future developments in this area. These data were used in the book to depict the percentage of people currently residing in slums and the potential situation in 2050.
United Nations Statistics Division (2025).SDG indicators. Goal 11. https://unstats.un.org/sdgs/report/2024/Goal-11/#:~:text=Globally%2C%20approximately%20one%20quarter%20of,10%20individuals%20have%20convenient%20access. Accessed March 16, 2025.
9 Illiteracy
Statistisches Bundesamt (2025). Internationales: Alphabetisierung der Weltbevölkerung. https://www.destatis.de/DE/Themen/Laender-Regionen/Internationales/Thema/bevoelkerung-arbeit-soziales/bildung/Alphabetisierung.html. Accessed March 4, 2025.
As a government institution, Germany’s Federal Statistical Office (Statistisches Bundesamt) collects official data on society, the economy, the environment and the public sector. The right to education is closely linked to the literacy rate and the UN’s Sustainable Development Goals. The Federal Statistical Office publishes data on the global literacy rate, which were used for the discussion of illiteracy in the book.
Bundesministerium für Bildung und Forschung (2025). Zahlen und Fakten. https://www.xn--mein-schlssel-zur-welt-0lc.de/de/helfen/zahlen-und-fakten/zahlen-und-fakten.html. Accessed March 4, 2025.
The Federal Ministry of Education and Research is one of Germany’s national government bodies. Creating an education policy for Germany requires having an overview of the literacy rate, i.e. the reading and writing abilities of the population as a whole. Surveys and studies are regularly carried out for this purpose. The illustration in the book depicts data from the federal ministry, an independent source.
UNESCO (2024). International Literacy Day, September 8.https://www.unesco.org/en/days/literacy. Accessed March 16, 2025.
10 Education
Statista (2025). Educational attainment worldwide in 2020, by gender and level. https://www.statista.com/statistics/1212278/education-gender-gap-worldwide-by-level/. Accessed March 4, 2025.
Data provider Statista published information on education levels among the world’s population in 2020. The levels are divided into primary, secondary and tertiary education. Data from Statista were selected because they clearly show the global distribution of education by gender and they are accessible online. It was possible to determine an average value for education levels based on the assumption that the gender distribution between women and men is equal around the world, i.e. each group comprises 50 percent of the total.
Encyclopedia Britannica (2025). Education. https://www.britannica.com/topic/education Accessed March 16, 2025.
11 Work
Statistisches Bundesamt (2025). Konjunkturindikatoren: Erwerbstätige im Inland nach Wirtschaftssektoren. https://www.destatis.de/DE/Themen/Wirtschaft/Konjunkturindikatoren/Lange-Reihen/Arbeitsmarkt/lrerw13a.html. Accessed March 4, 2025.
Germany’s Federal Statistical Office provides the public with impartial, objective, independent data. Its surveys on employment and demographic trends generate figures that politicians use to make democratic, fact-based decisions for business and society. Data from the Federal Statistical Office for the year 2023 were used to determine the number of people employed in agriculture, industry and services in Germany, data that serve as the basis for the illustration in the book.
International Labour Organization (ILO) (2023). World Employment and Social Outlook. Trends 2023. Geneva. https://www.ilo.org/sites/default/files/wcmsp5/groups/public/%40dgreports/%40inst/documents/publication/wcms_865332.pdf. Accessed March 5, 2025.
The International Labour Organization (ILO) promotes social justice and internationally recognized human and workers’ rights. The figure of 3.6 billion people was taken from the ILO report for the working population in 2022 and then divided by the global population for 2022. The ILO’s extensive datasets on global employment and labor rights are publicly available.
World Bank Group (2025). Employment in agriculture, industry, and services (% of total employment) (modeled ILO estimate). https://data.worldbank.org/indicator/SL.AGR.EMPL.ZS. Accessed March 4, 2025.
World Bank Group (2025). Employment in services (% of total employment) (modeled ILO estimate). https://data.worldbank.org/indicator/SL.SRV.EMPL.ZS. Accessed March 4, 2025.
World Bank Group (2025). Employment in industry (% of total employment) (modeled ILO estimate). https://data.worldbank.org/indicator/SL.IND.EMPL.ZS. Accessed March 4, 2025.
The ILO also compiles data on the number of workers in various labor sectors that are included in a World Bank Group database. Data from the World Bank and ILO were used to depict the global workforce in the agricultural, industrial and service sectors.
The estimated total global population (World Bank Group 2022), the share of the global population in the workforce and the share of workers in the three sectors (World Bank Group) were used to calculate the percentages of the global working population in the three sectors for the year 2022.
Note: For the illustration, the calculated percentage of the global workforce in the services sector was rounded down to 22 people (22.53 percent). This simplification serves to illustrate the global distribution of employment based on 100 people.
12 Income
World Bank Group (2024). The Middle-Income Trap. World Development Report 2024. Washington DC https://www.worldbank.org/en/publication/wdr2024?cid=ECR_E_NewsletterWeekly_EN_EXT&deliveryName=DM226534. Accessed March 4, 2025.
The World Bank Group regularly collects data on income (measured in US dollars) in the world’s countries and regions as an indicator of prosperity and how it is changing. The percentages of the world’s population are allocated to the defined income groups. The annual income of the groups is based on gross national income (GNI) per capita, which was converted into US dollars and divided by the size of the population. The definitions of the income groups were taken from the World Bank report. This information on income is very valuable for depicting the world’s population, i.e. tracking income in global regions and among the global population and identifying data clusters for various topics.
13 Assets
Shorrocks, Anthony, James Davies and Rodrigo Lluberas (2022). Global Wealth Databook 2022. Leading perspectives to navigate the future. Crédit Suisse Research Institute: n.p., page 21. https://bibbase.org/network/publication/shorrocks-davies-lluberas-globalwealthdatabook2022-2022. Accessed March 4, 2025.
Crédit Suisse AG is a major international bank (now part of UBS AG). The bank’s Research Institute regularly produces studies and comparisons of international data. The bank’s 2022 report is available online and shows the global wealth distribution of the world’s adult population in percentage terms. Wealth groups were defined, including the value of their assets in US dollars, and their shares of the world’s adult population were calculated. Due to its scope and contextualization (e.g. the change in global wealth structures), the Crédit Suisse AG report was selected as the source for the information on assets.
14 Bank accounts
Demirgüç-Kunt, Asli, Leora Klapper, Dorothe Singer and Saniya Ansar (2022). The Global Findex Database 2021. Financial Inclusion, Digital Payments, and Resilience in the Age of COVID-19. World Bank Group, Washington DC. Page 17. https://www.worldbank.org/en/publication/globalfindex/Report. Accessed March 4, 2025.
As a specialized international organization, the World Bank publishes various types of information, including the Global Findex Database, which offers data and analyses on access to financial markets by people around the world. The 2021 report shows that the share of people in developing countries who have some type of financial account has risen by 30 percentage points in recent decades. However, the gap between women and men has narrowed by 3 percentage points during this period. The World Bank’s report is comprehensive, containing datasets for various regions and countries. Globally, population development is linked to access to the financial market and social services; the data in the report illustrate this development and were therefore used for the depiction of bank accounts in the book.
15 Health insurance
World Health Organization (WHO) (2023). Universal health coverage (UHC). https://www.who.int/news-room/fact-sheets/detail/universal-health-coverage-(uhc). Accessed March 4, 2025.
Data released in an online report by the World Health Organization (WHO) showed that an estimated 4.5 billion people did not have adequate access to essential health services in 2021. Of these 4.5 billion people, 2 billion experience financial difficulties due to the cost of health care. And of these 2 billion, 1 billion even face catastrophic financial problems as a result of their need for medical services. These figures were applied to the total global population of 7.92 billion people to illustrate how access to medical care varies and, consequently, how different the realities of people’s lives are in this area.
16 Mental health
World Health Organization (WHO) (2022). Mental disorders. https://www.who.int/news-room/fact-sheets/detail/mental-disorders. Accessed March 4, 2025.
Data from the World Health Organization (WHO) was used for this category. WHO publishes data on the global population and the prevalence of mental disorders. Thanks to its many member countries and its status as a UN agency, the organization is able to collect and evaluate an extensive range of data – and was therefore used as a source for the information on mental health. The fact that one in eight people around the world suffers from a mental disorder was taken from the WHO fact sheet.
Queensland Brain Institute (2024). Half of world’s population will experience a mental health disorder. Harvard Medical School. https://hms.harvard.edu/news/half-worlds-population-will-experience-mental-health-disorder. Accessed March 20, 2025.
17 Meat consumption
IfD Allensbach and Statista (2023). Anzahl der Personen in Deutschland, die sich selbst als Vegetarier einordnen oder als Leute, die weitgehend auf Fleisch verzichten, von 2015 bis 2023 (in Millionen). https://de.statista.com/statistik/daten/studie/173636/umfrage/lebenseinstellung-anzahl-vegetarier/. Accessed March 4, 2025.
A publication by Statista and the IfD Allensbach opinion research institute was used for the illustration of meat consumption and vegetarianism/veganism. Given the detailed empiric data contained in the publication, it was also used for the depiction of vegetarianism/veganism in Germany, including the share of people in the country who self-identified as vegetarians in 2023.
Friedrichsen, Jana, and Manja Gärtner (2020). Why Are We Eating so Much Meat? DIW Roundup: Politik im Fokus 137. DIW Berlin. https://www.diw.de/documents/publikationen/73/diw_01.c.741618.de/diw_roundup_137_en.pdf. Accessed March 4, 2025.
DIW Berlin (the German Institute for Economic Research) publishes scientific articles at regular intervals. The article by Friedrichsen and Gärtner on the topic of vegetarianism appeared on the DIW Berlin website. In the article, the authors take a scientific look at the reasons people adopt a meat-based or vegetarian diet and the resulting impacts on health worldwide. An estimate of the share of vegetarians in the world population was taken from the article as the basis for the figures provided in the book.
18 Lactose intolerance
MedlinePlus (2023). Lactose intolerance. https://medlineplus.gov/genetics/condition/lactose-intolerance/#frequency. Accessed March 4, 2025.
This official US government site educates the public about health issues. MedlinePlus was used as a source for the book in light of the extent and accessibility of the information and the scientific descriptions it contains. An estimate of the percentage of the world’s population that is lactose intolerant was taken from the article on the topic found on the site.
19 Overweight
Statistisches Bundesamt (2025). Europa: Mehr als die Hälfte der Erwachsenen hat Übergewicht. https://www.destatis.de/Europa/DE/Thema/Bevoelkerung-Arbeit-Soziales/Gesundheit/Uebergewicht.html. Accessed March 4, 2025.
In its information on obesity in the German population, the Federal Statistical Office states that 54 percent of German adults are overweight (as of 2019). This source was used since its data are publicly available and it provides an overview of the issue of obesity.
World Health Organization (WHO) (2024). Obesity and overweight, Key Facts. https://www.who.int/news-room/fact-sheets/detail/obesity-and-overweight#:~:text=Worldwide%20adult%20obesity%20has%20more,16%25%20were%20living%20with%20obesity. Accessed March 4, 2025.
Data are regularly collected to monitor where people are underweight and overweight around the globe and to draw attention to changes in the situation. These surveys are a valuable source for determining the share of the (adult) population that is overweight. In its key facts for 2022, WHO identifies 2.5 billion adults as being overweight.
World Health Organization (WHO) (2021). Obesity. https://www.who.int/news-room/facts-in-pictures/detail/6-facts-on-obesity#:~:text=Overweight%20and%20obesity%20are%20linked,income%20and%20middle%2Dincome%20countries. Accessed March 16, 2025.
20 Malnutrition
World Health Organization (2024). Hunger numbers stubbornly high for three consecutive years as global crises deepen: UN Report (2023). https://www.who.int/news/item/24-07-2024-hunger-numbers-stubbornly-high-for-three-consecutive-years-as-global-crises-deepen--un-report. Accessed March 4, 2025.
The World Health Organization (WHO) is a specialized agency of the United Nations that focuses on people’s health worldwide. To do this, it requires comprehensive data and reports from every country in the world. The organization’s work enables it to adapt global health-development targets as needed while publishing warnings about infectious diseases and new pathogens. WHO compiles and makes use of extensive datasets and reports for this purpose. The WHO report on the current global malnutrition situation was therefore used as a source for this book.
Food and Agriculture Organization of the UN (2015). The State of Food Insecurity in the World. Meeting the 2015 international hunger targets: taking stock of uneven progress. Rome. https://openknowledge.fao.org/server/api/core/bitstreams/63863832-4cb5-4e05-9040-4b22d9a92324/content. Accessed March 4, 2025.
The Food and Agriculture Organization (FAO) is a specialized agency of the United Nations. For decades, FAO has been carrying out support measures in 130 countries and publishing reports on what it has found there. The organization’s extensive information on the food situation is publicly available and was therefore used as a source for the book. The FAO’s 2015 report showed that between 1990 and 1992 approximately 19 percent of the world’s population suffered from malnutrition.
21 Toilets
Statista (2022). Bevölkerungsanteil mit Zugang zu sicheren Sanitäranlagen nach Weltregionen im Jahr 2022. https://de.statista.com/statistik/daten/studie/1021970/umfrage/zugang-zu-sicheren-sanitaeranlagen-nach-weltregionen/. Accessed March 4, 2025.
In its information on health systems, Statista publishes findings from a survey on safe access to sanitation facilities worldwide. Toilet access was defined in the survey as a safe and well-maintained sanitation facility, i.e. a facility that is connected to a sewage system, sewage treatment plant or an upgraded pit latrine. In addition, the facility may only be used by one household. Based on these data and the above definition, this source was selected to illustrate global conditions and the realities people face in their everyday lives when it comes to sanitation (hygiene, health, environment).
World Health Organization (WHO) (2024). Sanitation. https://www.who.int/news-room/fact-sheets/detail/sanitation. Accessed April 1, 2025.
22 Clean drinking water
World Health Organization (WHO) (2024). Proportion of population using safely managed drinking-water services (%). https://data.who.int/indicators/i/5131A52/1548EA3. Accessed March 4, 2025.
The World Health Organization (WHO) is a specialized agency of the United Nations that contributes to improving the level of health worldwide. Drawing on the WHO database, its article on drinking water shows that the share of the world’s population with access to safe and clean drinking water has increased significantly, from 61 percent in 2000 to 73 percent in 2022. Both figures have been used in the book to illustrate how access to drinking water has changed around the globe. The WHO datasets are regularly checked to ensure they are up to date. In addition, the methodology used for data collection has been adapted in recent decades. WHO uses various definitions to identify safe access to drinking water.
United Nations (n.d.). Human Rights to Water and Sanitation. https://www.unwater.org/water-facts/human-rights-water-and-sanitation#:~:text=Access%20to%20water%20and%20sanitation,safely%20managed%20water%20and%20sanitation. Accessed March 18, 2025.
Michel, David (2024). What Causes Water Conflict? https://www.csis.org/analysis/what-causes-water-conflict. Accessed March 16, 2025.
King, Marcus (2024). Climate Change and the Water Weapon: How Rising Temperatures are Expanding the Footprint of Conflict. https://commonhome.georgetown.edu/issues/spring-2024/climate-change-and-the-water-weapon-how-rising-temperatures-are-expanding-the-footprint-of-conflict/. Accessed March 16, 2025.
23 Electricity
United Nations Statistics Division (2025). Affordable and clean energy. https://unstats.un.org/sdgs/report/2023/Goal-07/#:~:text=The%20global%20electricity%20access%20rate,2021%2C%20mostly%20located%20in%20LDCs. Accessed March 4, 2025.
The UN is committed to promoting economic and social progress for people everywhere around the globe. As a result, it publishes information on where people do and do not have access to electricity. For decades, member countries have provided reports on electricity access and use that the UN has analyzed to create its estimates. This extensive dataset has been a particularly important source for this book.
World Bank Group (2023). Access to electricity (% of population). https://data.worldbank.org/indicator/EG.ELC.ACCS.ZS?end=2021&start=2000. Accessed March 4, 2025.
The World Bank Group – in cooperation with the International Energy Agency (IEA), International Renewable Energy Agency (IRENA), United Nations Statistics Division (UNSD) and World Health Organization (WHO) – publishes data on electricity access for the world’s population. A comprehensive dataset is available for the years 1998 to 2021. For the book, the dataset for the year 2000 was compared with the dataset for 2021 to illustrate how access to electricity has changed over the last two decades for people around the globe.
United Nations (n.d.). Universal Access to Electricity. https://unite.un.org/sites/unite.un.org/files/app-desa-electrification/index.html. Accessed March 16, 2025.
International Energy Forum (2022). Four Ways Energy Access Will Drive the UN’s Sustainable Development Goals. https://www.ief.org/news/four-ways-energy-access-will-drive-the-uns-sustainable-development-goals. Accessed March 16, 2025.
24 Washing machines
Statista (2021). Anteil der privaten Haushalte in Deutschland mit einer Waschmaschine von 2011 bis 2021. https://de.statista.com/statistik/daten/studie/516859/umfrage/private-haushalte-in-deutschland-mit-waschmaschine/. Accessed March 4, 2025.
Statista publishes data on the ownership of washing machines by German households. Its website states that 96.2 percent of the country’s private households owned a washing machine in 2021. Statista’s data are comprehensive and were supplemented by consumer income sampling, i.e. random members of the public were asked about the electrical appliances they own. The Statista percentage was used for the illustration in the book.
International Energy Agency (IEA) (2023). Global average household ownership of appliances in the Net Zero Scenario, 2000–2030. https://www.iea.org/data-and-statistics/charts/global-average-household-ownership-of-appliances-in-the-net-zero-scenario-2000-2030. Accessed March 4, 2025.
The IEA is an intergovernmental organization with 32 member countries that is primarily concerned with exchanging information on the development and introduction of new energy technologies. According to IEA data on the global use of electrical appliances, in 2022 every household worldwide owned 0.52 units of a washing machine. From this, it was calculated that, in 2022, 52 washing machines were owned by every 100 households worldwide.
25 Internet
Statista (2025). Worldwide internet user penetration from 2014 to February 2025. https://www.statista.com/statistics/325706/global-internet-user-penetration/. Accessed March 4, 2025.
Statista publishes national and global data. In cooperation with Kepios (a digitally oriented consulting firm), Statista collects information on the number of internet users worldwide. The dataset spans 10 years and was updated in 2025. This dataset was selected for the book because it offers information on the percentage of people around the world who access the internet.
Statista (2024). Share of households with internet access in Germany from 2010 to 2023. https://www.statista.com/statistics/377677/household-internet-access-in-germany/#:~:text=In%202022%2C%20the%20share%20of,unchanged%20at%20around%2091.41%20percen. Accessed March 4, 2025.
In its information on demographics, Statista publishes data on the prevalence of internet access in Germany. Its survey shows that almost all German households have an internet connection: 91.66 percent in 2023. The data cover a period of ten years and are available online, two reasons why this dataset was used for the book.
United Nations. (n.d.). Child and Youth Safety Online. https://www.un.org/en/global-issues/child-and-youth-safety-online. Accessed March 16, 2025.
Heinz Nixdorf Forum (n.d.). Die Welt im Netz – Die Geschichte des Internets. https://www.hnf.de/dauerausstellung/ausstellungsbereiche/global-digital/die-welt-im-netz-die-geschichte-des-internets.html. Accessed March 16, 2025.
26 Travel abroad
UN Tourism (formerly World Tourism Organization) (2025). International tourism recovers pre-pandemic levels in 2024. https://www.unwto.org/news/international-tourism-recovers-pre-pandemic-levels-in-2024. Accessed March 18, 2025.
UN Tourism is a specialized United Nations (UN) agency which is recognized as the world’s leading organization for tourism. It analyzes travel behavior worldwide and tracks achievement of the Sustainable Development Goals, releasing publications on both activities. For the illustration in the book, the estimated number of international tourists traveling in 2024 was taken from the UN Tourism dataset, then divided by the estimated global population for 2023 from the World Bank dataset.
Note: Due to the lack of information on the world’s population for 2024 in the World Bank dataset at the time the illustration for “Travel abroad” was calculated, the estimated population for 2023 was used instead.
UN Tourism (formerly World Tourism Organization) (2025). Sustainable Development Goals (SDGs). https://www.unwto.org/tourism-statistics/economic-contribution-SDG. Accessed March 16, 2025.
27 Smartphones
Statista (2024). Telecommunication: Number of smartphone users worldwide from 2014 to 2029 (in millions). https://www.statista.com/forecasts/1143723/smartphone-users-in-the-world. Accessed March 4, 2025.
In its information on telecommunications, Statista publishes historical data and forecasts on the number of smartphone users worldwide. It calculated the relevant dataset based on the Global Consumer Survey. This source was selected for the text and illustration in the book due to its scope and inclusion of the global population. Statista estimated the number of smartphone users in 2022 at 4.74 billion people. An estimated global population of 7.99 billion people (World Bank Group) was used to determine the share of smartphone users that appears in the graphic.
Statista (2024). Anteil der Smartphone-Nutzer* in Deutschland in den Jahren 2012 bis 2023 und Prognose bis 2030. https://de.statista.com/statistik/daten/studie/585883/umfrage/anteil-der-smartphone-nutzer-in-deutschland/. Accessed March 4, 2025.
Statista also publishes historical data and forecasts on smartphone users in Germany, calculating the relevant dataset based on various data sources. From 2022 onwards, the data come from sources that cover the entire German population. Data from Statista were used since they reflect the topicality of smartphone use and its dynamic development globally. The illustration is based on data for 2022, which show that 81.1 percent of the German population uses a smartphone.
Boston University College of Communication (2018). The Past, Present, and Future of Smartphone. https://sites.bu.edu/cmcs/2018/09/14/the-past-present-and-future-of-smartphone/. Accessed March 16, 2025.
University of California (2017). Your smartphone’s hidden history. https://www.universityofcalifornia.edu/news/your-smartphones-hidden-history. Accessed March 16, 2025.
28 Cars
Statista (2015). Percentage of households owning a car in selected countries in 2014, by country. https://www.statista.com/statistics/516280/share-of-households-that-own-a-passenger-vehicle-by-country/. Accessed March 4, 2025.
In its information on vehicles and road traffic, Statista publishes survey results (from face-to-face interviews) on car ownership among households in selected countries worldwide. The data used for the illustration in the book were chosen based on their scope and global nature. The figures show that around 1.25 billion people owned a car for private use in 2014, or 17 percent of the estimated global population of 7.35 billion people (World Bank Group 2014). The data from this source cover only a subgroup of the world’s countries – many are not included in the dataset. More timely data from reliable sources on the number of cars per household worldwide were not available at the time this book went to press.
Statista (2021). Bevölkerung in Deutschland nach Anzahl der PKW im Haushalt von 2018 bis 2021 (Personen in Millionen). https://de.statista.com/statistik/daten/studie/172093/umfrage/anzahl-der-pkw-im-haushalt/. Accessed March 4, 2025.
Statista also publishes data on car ownership in Germany, according to which around 77 percent of the country’s households had at least one car in 2021. This figure was also published by the Federal Statistical Office for 2021. This source was used for the book to compare car ownership among the German population with households worldwide.
Statista (2024). Weltweiter Kfz-Bestand bis 2020. https://de.statista.com/statistik/daten/studie/244999/umfrage/weltweiter-pkw-und-nutzfahrzeugbestand/#:~:text=Mehr%20Fahrzeuge%20weltweit%20als%20je,global%20registrierten%20Kraftfahrzeuge%20kontinuierlich%20an. Accessed March 16, 2025.
Polst, Svenja, Patrick Mennig, Anna Schmitt and Katrin Scholz (2022).„Mobilitätswende 2030“. Vom Linienbus zur öffentlichen Mobilität der Zukunft. Fraunhofer IESE, Kaiserslautern. https://www.iese.fraunhofer.de/content/dam/iese/publikation/smart-region-mobilitaetswende-2030-fraunhofer-iese.pdf. Accessed March 16, 2025.
29 CO2 emissions
Chancel, Lucas, Thomas Piketty, Emmanuel Saez and Gabriel Zucman (2021). World Inequality Report 2022. Paris. https://wir2022.wid.world/www-site/uploads/2021/12/WorldInequalityReport2022_Full_Report.pdf. Accessed March 4, 2025.
The World Inequality Report 2022 shows the amount of carbon emissions generated by various income groups worldwide (in 2019). The group with the top 1 percent of income is responsible for around 17 percent of total emissions – compared to 50 percent of the world’s population (lower and lowest income groups), which emits 12 percent. As defined by the researchers, the carbon footprints include domestic consumption, public and private investments, and imports and exports of carbon (in the form of goods and services). The data from the World Inequality Laboratory was used for the book since they are robustly evidence-based and they show the global relationship between income and emissions.
University of California (2017). Where do greenhouse gas emissions come from? https://www.universityofcalifornia.edu/news/where-do-greenhouse-gas-emissions-come. Accessed March 16, 2025.
European Youth Portal (2024). How to reduce my carbon footprint? https://youth.europa.eu/get-involved/sustainable-development/how-reduce-my-carbon-footprint_en. Accessed March 16, 2025.
30 Threats from climate change
European Commission (2023). DG Research and Innovation welcomes the Intergovernmental Panel on Climate Change (IPCC) report. https://research-and-innovation.ec.europa.eu/news/all-research-and-innovation-news/dg-research-and-innovation-welcomes-intergovernmental-panel-climate-change-ipcc-report-2023-03-20_en#:~:text=Sea%20level%20rise%20is%20unavoidable,highly%20vulnerable%20to%20climate%20change. Accessed March 4, 2025.
The European Commission is the European Union’s main executive body. It publishes reports on the objectives and progress of measures that affect the entire EU and its partners. The IPCC report clearly shows that climate change is endangering 3.3 billion to 3.6 billion people. For the illustration in the book, the mean value of 3.45 billion people was calculated and divided by the global population of 7.99 billion (World Bank Group 2022).
World Bank Group (2022b, October 19). What you need to know about food security and climate change. https://www.worldbank.org/en/news/feature/2022/10/17/what-you-need-to-know-about-food-security-and-climate-change. Accessed March 16, 2025.
31 Life in conflict regions
Caravaggio, Isabella, and Gregory Connor (2023) Five things to know about the New Agenda for Peace. United Nations Development Programme. https://www.undp.org/blog/five-things-know-about-new-agenda-peace#:~:text=Twenty%2Dfive%20percent%20of%20the,since%20the%20second%20world%20war. Accessed March 4, 2025.
The United Nations Development Programme (UNDP) is a development organization active in 170 countries and territories worldwide. In their online article, Caravaggio and Connor highlight the need to take action, since 25 percent of the world’s population lived in areas affected by (military) conflict in 2023. The percentage of people worldwide living in conflict areas was taken from this source. This information on conflicts and people at risk was used for the book because, on the one hand, it shows the drastic development in recent years and, on the other, it illustrates the situation vis-à-vis the rest of the world’s population.
Heidelberg Institute for International Conflict Research (HIIK) (2024). Conflict Barometer 2023. Heidelberg. https://hiik.de/konfliktbarometer/aktuelle-ausgabe/. Accessed March 16, 2025.
32 Democracies and autocracies
V-Dem Institute (2023). Democracy Report 2023. Defiance in the Face of Autocratization. Göteborg. https://www.v-dem.net/documents/29/V-dem_democracyreport2023_lowres.pdf Accessed March 4, 2025.
The V-Dem Institute is the umbrella organization of the V-Dem Project, which focuses on assessing democracies worldwide. The actual measurements are based on data from five experts per country and year, drawing on a total pool of over 4,000 country experts. For the year 2022, the authors show that 72 percent of the world’s population lives in countries and territories with autocratic regimes. For several years, V-Dem has been a global leader in the scientific measurement and depiction of autocracy and democracy processes.
Our World in Data (2025). People living in democracies and autocracies, World. https://ourworldindata.org/grapher/people-living-in-democracies-autocracies. Accessed March 4, 2025.
The website Our World in Data offers graphical representations of empirical surveys and data analyses on the societal and global level. Data for 2001 from the table “People Living in democracies and autocracies, World” were used to depict the development of democracy over time presented in the book. The absolute values – in billions of people living in “electoral and liberal democracies” – were added together and divided by the estimated world population in 2001. This shows that the development of democratic and autocratic regimes is not static. Their global distribution has changed over more than 20 years, influencing the reality people face in their everyday lives.
Gabler Wirtschaftslexikon (2018). Gewaltenteilung. https://wirtschaftslexikon.gabler.de/definition/gewaltenteilung-33241/version-256768. Accessed March 16, 2025.
Gabler Wirtschaftslexikon (2018). Indirekte Demokratie. https://wirtschaftslexikon.gabler.de/definition/indirekte-demokratie-33370/version-256897. Accessed March 16, 2025.
Gabler Wirtschaftslexikon (2018). Demokratie. https://wirtschaftslexikon.gabler.de/definition/demokratie-30416/version-253998. Accessed March 16, 2025.
33 Safety
United Nations (2022). The Sustainable Development Goals Report 2022. New York. Pages 58–59: Goal 16. https://unstats.un.org/sdgs/report/2022/The-Sustainable-Development-Goals-Report-2022.pdf. Accessed March 18, 2025.
In addition to the global security situation, the report by the UN Department of Economic and Social Affairs on Sustainable Development Goal 16 – Peace, Justice and Strong Institutions – also examines perceptions of safety within societies. According to the report, a third of the world’s population, predominantly women, say they do not feel safe walking alone in their neighborhood at night. The data were collected between 2019 and 2021 in several countries around the world. The information presented in the book is based on this detailed report, providing a local perspective on whether people feel safe in their immediate environment.
34 Civil liberties
Freedom House (2025). Countries and Territories. https://freedomhouse.org/countries/freedom-world/scores. Accessed March 4, 2025.
In its annual Freedom in the World report, Freedom House rates people’s access to political rights and civil liberties. From these evaluations, the non-governmental organization regularly ranks the world’s countries based on how free they are. The dataset is accessible online and groups countries into three categories: free, partly free, not free. This ranking (based on political rights and civil liberties) was used for the book since the underlying database is extensive and represents current global conditions. The country data from the rankings were summed in each of the three categories using the population data for individual countries (from the “World” dataset). This made it possible to determine the global breakdown into free, partly free and non-free subsets.
Note: For the category “Civil Liberties,” the percentage of the world population that is “free” was rounded down from 21.5 to 21 percent, and the other two values – 40.8 percent and 37.6 percent – were rounded up to maintain the total of 100 people seen in the illustration. For reasons of data availability, population figures were taken from World Bank data for 2022 and country rankings from Freedom House for 2023.
35 Access to rule of law
Independent Evaluation Office (IEO) of the United Nations Development Programme (UNDP) (2023). Evaluation of the UNDP Support to Access to Justice. https://erc.undp.org/evaluation/documents/download/22269. Accessed March 4, 2025.
In the report “Evaluation of UNDP Support of Access to Justice,” the Independent Evaluation Office (IEO) states that the international community’s commitment to granting everyone access to rule of law by 2030 is not being fulfilled. Two-thirds of the world’s population (5.1 billion people) live without such access. As a result, a large share of people around the world cannot seek justice and must forgo legal remedies. This in turn means that many of these rights – which apply worldwide – are constantly under threat. The IEO report was used as a source for the book due to its scope and the independence of its authors. For the book’s illustration, the figure of 5.1 billion people without access to rule of law was divided by the estimated total world population of 7.99 billion people (World Bank Group 2022).
36 Academic freedom
Friedrich-Alexander-Universität Erlangen-Nürnberg (2023). Academic freedom deteriorates in 22 countries. Researchers at the University of Gothenburg and FAU Erlangen-Nürnberg publish the Academic Freedom Index 2023 Update. https://www.fau.eu/2023/03/news/research/academic-freedom-deteriorates-in-22-countries/. Accessed March 4, 2025.
The Academic Freedom Index (AFI) is the result of an international collaboration involving over 2,000 country experts. Researchers from the V-Dem Institute at the University of Gothenburg and the Institute of Political Science at Friedrich-Alexander-Universität Erlangen-Nürnberg (FAU) cooperated to analyze the data for several countries. They found that around 4 billion people worldwide were affected by the decline in academic freedom in 2022. The Academic Freedom Index was used as a source for the book in light of the AFI’s scientific standards and the scope of its data.
Gabler Wirtschaftslexikon (2022). Wissenschaftsfreiheit. https://wirtschaftslexikon.gabler.de/definition/wissenschaftsfreiheit-121063/version-385416. Accessed March 16, 2025.
37 Freedom of the press
Reporters without borders (2025). Global score (2023). https://rsf.org/en/index?year=2023. Accessed March 4, 2025.
Reporters Without Borders compares the situation of journalists and media in 180 countries and territories around the world in order to create the World Press Freedom Index. The index is based on five indicators: safety, political context, legal framework, economic context and socio-cultural context. The data are collected using a qualitative survey containing over 100 questions that is sent to selected journalists, academics and human rights defenders in the participating countries. The index is thus a comprehensive and critical source for evaluating press freedom. Based on the results, each country is assigned a score. In 2023, countries were classified into the categories “good to satisfactory,” “problematic,” “difficult” and “very serious.” The population of the respective countries (World Bank Group, 2022) was then assigned to the relevant categories and the totals calculated.
Reporter ohne Grenzen (n.d.) Informationsfreiheit im Internet. https://www.reporter-ohne-grenzen.de/themen/internetfreiheit. Accessed March 18, 2025.
Reporter ohne Grenzen (n.d.). Pressefreiheit – warum?https://www.reporter-ohne-grenzen.de/themen/pressefreiheit-warum. Accessed March 16, 2025.
38 Corruption
Transparency International (2025). Corruption Perceptions Index (2023). https://www.transparency.org/en/cpi/2023?gclid=EAIaIQobChMI5M7_kLWWhAMV0kJBAh1aPwH9EAAYAiAAEgI0NfD_BwE&gad_source=1. Accessed March 4, 2025.
The global trend towards weaker systems of justice is leading to ever lower levels of accountability for public officials and individuals – which in turn suggests a rise in corruption. Both authoritarian and democratic governments can foster circumstances that lead to such a rise. The non-governmental organization Transparency International is committed to documenting this development in order to raise awareness of the problem and bring about positive change, i.e. reducing corruption worldwide. The Transparency International ranking was selected as the source for 2023 since the organization maintains a global database, assigning scores to individual countries based on how experts perceive corruption there. The corruption levels in the countries were supplemented by population figures for 2022 (World Bank).
Note: Since no figure for the global population was available from the World Bank for 2023 at the time the calculations for corruption were made, the estimated figure for 2022 was used.
Transparency International (2019). 25 corruption scandals that shook the world. https://www.transparency.org/en/news/25-corruption-scandals. Accessed March 18, 2025.
39 Gender equality
World Bank Group (2023). Women, Business and the Law 2023. Washington DC. https://openknowledge.worldbank.org/server/api/core/bitstreams/b60c615b-09e7-46e4-84c1-bd5f4ab88903/content. Accessed March 4, 2025.
This World Bank study examines how laws and regulations influence women’s economic opportunities. Eight indicators were used for the survey and subsequent evaluation: mobility, workplace, pay, marriage, parenthood, entrepreneurship, assets and pension. The study was chosen as the source for the book due to its quality, scope and depiction of everyday lives. Each country in the study was assigned a score based on the indicators, which was then supplemented with the country’s population figure (World Bank 2022). The countries were subsequently grouped into categories for gender equality based on their score: very high, high, medium high, low, very low.
40 Same-sex marriage
Pew Research Center (2024). Same-Sex Marriage Around the World. https://www.pewresearch.org/religion/fact-sheet/gay-marriage-around-the-world/. Accessed March 4, 2025.
Information on population by country was taken from the Pew Research Center (PRC) dataset. In its online report, PRC lists 30 countries that permit same-sex marriage as of 2024. The figures are based on an examination of case law and legislation in countries around the globe. There are 1.35 billion people living in countries that permit same-sex marriage, a figure calculated by summing population figures (World Bank) for the relevant countries.
ILGA World database (2024). Legal Frameworks. Criminalisation of consensual same-sex sexual acts. https://database.ilga.org/criminalisation-consensual-same-sex-sexual-acts. Accessed March 4, 2025.
Data from the non-governmental organization ILGA World was used as the source to illustrate where same-sex marriage is permitted and where homosexuality is illegal. It was possible to calculate the share of the world’s population living in countries where homosexuality is criminalized by combining data on the legal situation from ILGA and population figures by country from the World Bank. It was also possible to calculate the percentage of the world’s population living in countries that have legalized same-sex marriage and in countries that have not decriminalized homosexual acts but no longer prosecute them. Sexual freedom is a universal human right and a basis for freedom, dignity and equality for all people. This source was chosen given the scope of the ILGA dataset and the importance of the topic.
If you would like to know more about the institutions we have used as sources
Boston University
Bundesministerium für Bildung und Forschung
https://www.bmbf.de/EN/Home/home_node.html
Center for Strategic and International Studies (CSIS)
Central Intelligence Agency (CIA)
Crédit Suisse Research Institute
https://www.credit-suisse.com/about-us/en.html
Deutsches Institut für Wirtschaftsforschung (DIW Berlin)
https://www.diw.de/sixcms/detail.php?id=diw_01.c.617916.en
Deutsche Stiftung Weltbevölkerung (DSW)
Encyclopedia Britannica
European Commission
https://commission.europa.eu/about_en
European Youth Portal
https://youth.europa.eu/about-us_en
Food and Agriculture Organization of the United Nations (FAO)
Forschungsgruppe Weltanschauung in Deutschland (fowid)
Fraunhofer-Institut für Experimentelles Software Engineering (IESE)
https://www.iese.fraunhofer.de/en.html
Freedom House
Friedrich-Alexander-Universität Erlangen-Nürnberg (FAU)
Gabler Wirtschaftslexikon
https://wirtschaftslexikon.gabler.de
Georgetown University – Common Home magazine
https://commonhome.georgetown.edu/
Heinz Nixdorf Forum
https://www.hnf.de/en/the-hnf/our-mission.html
Heidelberg Institute for International Conflict (HIIK)
https://hiik.de/hiik/organization/?lang=en
IfD Allensbach
https://www.ifd-allensbach.de/
ILGA World
Independent Evaluation Office (IEO)
International Energy Agency (IEA)
International Energy Forum
MedlinePlus
Our World in Data
https://ourworldindata.org/about
Queensland Brain Institute
Pew Research Center
https://www.pewresearch.org/about/
Reporters Without Borders
Statista
https://www.statista.com/aboutus/
Statistisches Bundesamt
https://www.destatis.de/EN/About-Us/_node.html
Transparency International
https://www.transparency.org/en/about
UNESCO
UNICEF Data
https://data.unicef.org/about-us/
United Nations (UN)
https://www.un.org/en/about-us
United Nations Development Programme (UNDP)
United Nations iLibrary
UN Statistic Division
https://unstats.un.org/UNSDWebsite/about/
UN Tourism
https://www.unwto.org/about-us
University of California
https://www.universityofcalifornia.edu
V-Dem Institute
World Bank Group
https://www.worldbank.org/ext/en/who-we-are
World Health Organization (WHO)
World Inequality Database (WID)